Wednesday, April 4, 2018

Using Bio3D to convert 3 letter amino acid to 1 letter

Bio3D is a package written for the R platform. Details are in thegrantlab.org/bio3d/index.php


library(bio3d, lib.loc = "~/R")
pdb < - read.pdb("File.pdb")
atom.select(pdb,"calpha")$atom   ---- Gives the atom index of all alpha carbons
pdb$atom$resid    -- Gives the residue ID of all atoms

pdb$atom$resid(atom.select(pdb,"calpha")$atom)  --- Combines the two

Sunday, April 1, 2018

Scanning speed using Airport vs CUPS Driver

Just found out - the really painful way - that the Brother MFC L2700DW CUPS driver makes scanning documents 10-15 times faster than the default Airport driver that Apple automagically installs to make your life "simple". Guess it works great till you get into heavy usage. Haven't been able to set up the duplex scanning though. It was really the duplex scanning that took me to Brother's website which lists their CUPS driver for Macs. 

Wednesday, December 14, 2016

Resetting networking on RedHat 6.5

Networking on my work RHEL6.5 desktop got hosed recently and the following set of commands helped recover from the issue.

service nfs restart
service rpcbind restart
service sshd restart
service nscd restart
service network restart
service nslcd restart
service autofs restart

In addition to this I found that the /etc/resolv.conf was getting edited during reboot preventing the NFS server from working properly. While trying to find a solution to this problem I learned how to access non-responsive computers via grub login and then check the status of various services using /service xxx status/ and verify the on/off schedule of various services using chkconfig (or systemctl). It was quite a trip.

Edit: Apr 10, 2017
The same issue showed up again and this time also the /etc/resolv.conf file was being overwritten. Changing its attributes using
chattr +i /etc/resolv.conf
fixed the issue.

Wednesday, April 27, 2016

Drag down a formula to the end of sheet in MS Excel

After spending a decade in the Linux/Unix environment I am increasingly finding myself using MS tools at work - especially Excel. Before I get around to posting about Macros and Pivot Tables I wanted to document as much mouse-free experience as possible. This post is about mouse-free dragging of a formula across the sheet.

1. Ctrl+Down will tell you the last row in the sheet.
2. Select cell with the formula
3. In the Name box enter the column alphabet:row start to end (d2:d2000 for example)
4. Hit enter
5. Ctrl+D for (drag till end)

fillhandle01
[Source: http://blog.contextures.com/archives/2011/08/31/quickly-copy-excel-formula-down/]

fillhandle02


Friday, August 7, 2015

Installing Android on HP TouchPad

I successfully installed CyanogenMod Android on my old HP Touchpad recently and the relevant notes are below. Delighted to have a fully functioning tablet after watching it collect dust for years.

- Install Novocom first. This is needed for the next step.
- Install Touchpad Toolkit by JC Sullins. The relevant file is
  TPToolbox-2015-01-08-v42.zip which contains files for Windows, Mac and Linux.
tptb_v42_mac.command/tptb_v42_nix.sh/tptb_v42_win.bat/TPToolbox-2015-01-08-v42.bin
I used tptb_v42_mac.command on my Mac to facilitate the installation.
- Three critical files are necessary for a working Android OS
        - ROM, gApps and Recovery.
- ROM is the actual Android operating system. There seem to be hundreds of streams of ROMs each of which has nightly builds and regular version releases. LolliPop, KitKat, CyanogenMod etc.
- Since Android is (for some reason) tied to Google, gApps (Google Apps) is needed. Again there are gApps from various developers. There is no guarantee that a particular version of gApps will work smoothly or otherwise with any random version of ROM.
- Recovery, to me, sounds like swap space. Again hundreds of varieties exist. No guarantees on compatibilities with gApps versions or ROM versions.
- So while you have 3 buckets with red, green and blue balls, you cannot pull out a random ball (each different size) and expect them to just work.

Below are the results of 4 attempts the last of which is fully functional. The notes explain what was lacking in the unsuccessful installs.

Working: battery
Not working: No camera and buggy wifi (restarting wifi results in reboot):
-------------------------
gapps-lp-20150222-signed.zip
pac_tenderloin_LP.Beta-1.Unofficial_20150419-075314.zip
update-PhilZ_CWM-jcs-dm-tenderloin-20140612.zip

Working: camera works and wifi is clean
Not working: Battery does not charge (System says: Not charging AC)
------------------------
ev_tenderloin-5.1.1-testing-2015.05.13.zip
tk_gapps-modular-nano-5.1.1-20150613-signed.zip
update-PhilZ_CWM-jcs-dm-tenderloin-20140612.zip

Working: battery and wifi (not buggy)
Not working: No camera and random reboots.
------------------------
Slim_mini_gapps.BETA.5.1.build.0.x-20150612.zip
pac_tenderloin_LP-MR1.Beta-1.Unofficial_20150516-161123.zip
update-CWM-jcs-dm-tenderloin-20141231-2.zip

Fully functional - from June 12, 2015 version from JCSullins
------------------------
cm-11-20150612-SNAPSHOT-jcsullins-tenderloin.zip
gapps-kk-20140606-signed.zip
update-PhilZ_CWM-jcs-dm-tenderloin-20140612.zip

Various resources helped me in the process and below is a list of some of those links:
1. http://liliputing.com/2014/06/use-touchpad-toolbox-install-android-erase-webos-hp-touchpad.html
2. https://www.youtube.com/watch?v=bIc18AcuoW4
3. http://rootzwiki.com/topic/31548-rom-guide-how-to-install-android-23-43-on-the-hp-touchpad-the-easy-way/

Enjoy!

Monday, September 22, 2014

Replacing new line with something else using /sed/

sed ':a;N;$!ba;s/\n/ /g'

From here http://stackoverflow.com/questions/1251999/sed-how-can-i-replace-a-newline-n

Sunday, June 8, 2014

Uncurated notes on Gromacs GPU installation

This file is in /scratch [flute]

GPU installation on Spear was successful with this cmake

cmake .. -DGMX_GPU=ON -DCUDA_TOOLKIT_ROOT_DIR=/usr/local/cuda -DGMX_BUILD_OWN_FFTW=ON

[Performance]
12102 atoms CG

Using 2 MPI threads
Using 6 OpenMP threads per tMPI thread
Detecting CPU-specific acceleration.
Present hardware specification:
Vendor: AuthenticAMD
Brand:  AMD Opteron(tm) Processor 4184
Family: 16  Model:  8  Stepping:  1
Features: apic clfsh cmov cx8 cx16 htt lahf_lm misalignsse mmx msr nonstop_tsc pdpe1gb popcnt pse rdtscp sse2 sse3 sse4a
Acceleration most likely to fit this hardware: SSE2
Acceleration selected at GROMACS compile time: SSE2


2 GPUs detected:
  #0: NVIDIA Tesla M2050, compute cap.: 2.0, ECC: yes, stat: compatible
  #1: NVIDIA Tesla M2050, compute cap.: 2.0, ECC: yes, stat: compatible

2 GPUs auto-selected for this run.
Mapping of GPUs to the 2 PP ranks in this node: #0, #1

Cut-off's:   NS: 1.441   Coulomb: 1.2   LJ: 1.2
               Core t (s)   Wall t (s)        (%)
       Time:    48384.100     4035.993     1198.8
                         1h07:15
                 (ns/day)    (hour/ns)
Performance:     2140.737        0.011 <----------- font="">
Finished mdrun on node 0 Thu Mar 20 18:40:36 2014

------------ [CPU Edison install] ----------------
git clone git://git.gromacs.org/gromacs.git
module purge
module load intel
module load cmake
module load openmpi-ccm
module load fftw
mkdir 1049pm-mar24-build
export CCDIR=/opt/intel/composer_xe_2013_sp1.0.080/bin/intel64/
export MPICCDIR=/usr/common/usg/openmpi-ccm/1.6.5/intel/bin/
export FFTW_LOCATION=/opt/fftw/3.3.0.4/sandybridge/
export CXX=mpicxx
export CC=mpicc
mkdir ~/gromacs/1049pm-mar24-build/
cmake ../   -DFFTW3F_INCLUDE_DIR=$FFTW_LOCATION/include       -DFFTW3F_LIBRARIES=$FFTW_LOCATION/lib/libfftw3f.a       -DCMAKE_INSTALL_PREFIX=/global/homes/p/pavang/gromacs/1049pm-mar24-build/       -DGMX_X11=OFF       -DCMAKE_CXX_COMPILER=${MPICCDIR}/mpicxx       -DCMAKE_C_COMPILER=${MPICCDIR}/mpicc       -DGMX_MPI=ON       -DGMX_PREFER_STATIC_LIBS=ON -DFFTWF_LIBRARY=$FFTW_LOCATION/lib/libfftw3f.a -DFFTWF_INCLUDE_DIR=$FFTW_LOCATION/include

make
make install
source /global/homes/p/pavang/gromacs/1049pm-mar24-build/bin/GMXRC.bash 
mdrun_mpi -v -deffnm  em

[Performance]
38315 atoms Lysozyme in water

On 1 MPI rank, each using 32 OpenMP threads
               Core t (s)   Wall t (s)        (%)
       Time:     7596.371      252.435     3009.2
                 (ns/day)    (hour/ns)
Performance:       11.802        2.034 <-------------- font="">

Friday, March 28, 2014

Crystal Symmetry Operations

Pymol has a neat command to generate neighbor copies of proteins downloaded from PDB using their unit cell parameters.
 symexp sym = 401D, all, 3 

http://chemistry.osu.edu/~foster.281/biochem766/download/PDB/xray_tut_766.html

Saturday, March 1, 2014

Handling topologies of non-standard molecules in Gromacs

I have a file containing a protein chain and a non-standard ligand in a file [centered.pdb]. To obtain .top file
create a directory in the workspace and call it forcefield.ff.

export GMXLIB=$GMXLIB:$PWD/

The contents of that directory are:


ls -1 forcefield.ff/
aminoacids.c.tdb
aminoacids.hdb
aminoacids.n.tdb
aminoacids.r2b
aminoacids.rtp
aminoacids.vsd
atomtypes.atp
b12rtp
elements.dat
ffbonded.itp
ff_dum.itp
ffG53a6.itp
ffnonbonded.itp
forcefield.doc
forcefield.itp
gromos53a6.ff
ions.itp
old
org-aminoacidsrtp
spce.itp
spc.itp
tip3p.itp
tip4p.itp
watermodels.dat

The file aminoacids.itp has these lines added at the end:

[ Ligand ]
[ atoms ]
C27     C       0.38000 0 ; from        GLN     residue
O28     O       -0.38000 0 ; from       GLN     residue
N29     NT      -0.83000 0 ; from       GLN     residue
..

[ bonds ]
; ai aj gromos type
C26     C27 gb_27 ; from        GLN     fragment 0
C27     O28 gb_5 ; from GLN
C27     N29 gb_9 ; from GLN
...

[ dihedrals ]
; ai aj ak al gromos type
C3R     O2      P       O3 gd_20 ; from ADE     phosphate definition
C3R     O2      P       O3 gd_27 ; from ADE     phosphate definition
C2P     O3      P       O2 gd_20 ; from ADE     phosphate definition...


Then...

 pdb2gmx_sp -f centered.pdb  -o centered.pg.gro
...


Select the Force Field:
From current directory:
 1: GROMOS96 53a6 force field (JCC 2004 vol 25 pag 1656)
From '/usr/common/usg/gromacs/4.6.1-sp/share/gromacs/top':
 2: AMBER03 protein, nucleic AMBER94 (Duan et al.,.. 24, 1999-2012, 2003)
 3: AMBER94 force field (Cornell et al., JACS 117, 5179-5197, 1995)
...

16: [DEPRECATED] Encad all-atom force field, using full solvent charges
17: [DEPRECATED] Encad all-atom force field, using scaled-down vacuum charges
18: [DEPRECATED] Gromacs force field (see manual)
19: [DEPRECATED] Gromacs force field with hydrogens for NMR

Select 1 which is the forcefield contained in the directory forcefield.ff. This should run w/o errors and give a topol.top file. W/o editing topol.top running this code will give the following error;

grompp_sp -f min.mdp -c centered.pg.gro -p topol.top -o em.tpr
...

-------------------------------------------------------
Program grompp_sp, VERSION 4.6.1
Source code file: /global/homes/j/jdeslip/Builds/Hopper/gromacs-4.6.1/src/kernel/topio.c, line: 734

Fatal error:
Syntax error - File ffnonbonded.itp, line 1
Last line read:
'[ atomtypes ]'
Invalid order for directive atomtypes
For more information and tips for troubleshooting, please check the GROMACS
website at http://www.gromacs.org/Documentation/Errors
-------------------------------------------------------

So, hide the first line and add the default gromos53a6.ff

;#include "./forcefield.ff/forcefield.itp"
#include "gromos53a6.ff/forcefield.itp"

That should let grompp run smoothly.


Sunday, February 9, 2014

Remove white background in multiple images

convert file-with-white-bg.png -transparent white file-with-transparent-bg.png

Saturday, February 1, 2014

Ubuntu apt-get 'package has no installation candidate' error

I was trying to install a package using apt-get and realized that apt-get wouldn't install that or any other package. I found various suggestions to fix this problem:

Problem

$ sudo apt-get install scons
Reading package lists... Done
Building dependency tree      
Reading state information... Done
Package scons is not available, but is referred to by another package.
This may mean that the package is missing, has been obsoleted, or
is only available from another source

E: Package 'scons' has no installation candidate

Solution:

$ sudo apt-get update
$ sudo apt-get install build-essential
$ sudo dpkg --configure -a
$ sudo apt-get -f install

None of those worked in my case. I then went to Ubuntu Software Center>Edit> Software Sources and made these changes.


After that the following commands did the job
$ sudo apt-get update
$ sudo apt-get install build-essential
$ sudo apt-get install scons

Saturday, January 25, 2014

Changing desktop background and display themes

Accomplishing that is trivial in any OS but it is a good idea to do it once in a while to break the monotony and keep things fresh.

Tuesday, January 21, 2014

Calculating Rg using VMD

I am working on a system with 60 copies of a molecule which has 1287 atoms in it. The script below loads the trajectory and calculates the radius of gyration of each copy.

mol new system.gro

for {set num 0} {$num < 201} {incr num} {
mol addfile cen_md_$num.xtc waitfor all
}

for {set i 1} {$i <61} {incr i} {
set start [expr 1 + 1287 * ($i-1) ]
set end [expr 1287 * $i]
puts "$start $end"
set sel [atomselect top "serial $start to $end"]
set filename [open "rg-dextran-number-$i.txt" w]
puts "Number of frames is [molinfo top get numframes]";
for {set frame 0} {$frame < [molinfo top get numframes]} {incr frame} {
animate goto $frame
$sel update
puts $filename [format "%8.3f" [measure rgyr $sel]]
}
close $filename
}

quit

Weighted Histogram Analysis Method - WHAM

WHAM is used extensively to calculate the free energy of a system along a properly chosen reaction coordinate in molecular dynamics simulations or monte carlo simulations. To be able to use WHAM you need to perform multiple simulations that cover the entire reaction coordinate to sample possible configurations. The choice of reaction coordinate constitutes a length discussion and is a topic of ongoing debate. So I encourage the reader to look it up elsewhere. After you have chosen a reaction coordinate and performed Umbrella Sampling or Free Energy Perturbation calculations, histograms corresponding to every window need to be extracted.

For the simple case of dragging a methane molecule from water into a lipid bilayer and out into water again, z axis is a good reaction coordinate if the lipid bilayer is on the x-y plane. With this set up, the z axis is split into discrete windows and the center of mass (COM) of the methane molecule is constrained (usually harmonic) to the center of every window. The length of windows and force constant of the constraint are chose such that the distribution of the z coordinate of the COM of methane overlaps with the distribution of the adjacent windows. This is a necessary prerequisite for using WHAM. Following the figure below, for a 60A long reaction coordinate a choice of 121 windows (each 0.5A and including both ends) will be plenty to ensure overlap of z coordinate distributions.

Collect z coordinate distributions and put them 121 files labeled window-001 to window-121.
Create a new file input.in that contains the following lines;

./window-001 -30.0 xx
./window-002 -29.5 xx
...
./window-120 +29.5 xx
./window-121 +30.0 xx

Here the first column is the file name, second is the mean value of that window and the third column needs to be filled with an integer but is irrelevant and not used by Alan Grossfield's implmentation of WHAM. Then run the following command

./wham 1 11 10 0.001 300 0 input.in freefile

where the inputs are

./wham hist.min hist.max num.bins tol Temp numpad infile outfile

Figure Source: http://www.utdallas.edu/~son051000/comp/FreeE.pdf


The output contains a plot for the potential of mean force (PMF). Pay particular attention to units since they depend on your input. WHAM's documentation can be found here [http://membrane.urmc.rochester.edu/sites/default/files/wham/doc.html].

Thursday, January 16, 2014

Ubuntu grub rescue

Following are my notes while I successfully recovered Ubuntu 12.04-LTS from grub recovery mode.


I am using a Macbook Pro and trying to create a Ubuntu Live USB.

Create a Live USB using instructions from here.
http://www.ubuntu.com/download/desktop/create-a-usb-stick-on-mac-osx

This tells you how to work through grub rescue.
http://askubuntu.com/questions/197833/recovering-from-grub-rescue-crash

This video offers additional help
http://www.youtube.com/watch?v=8lod8sRb_6I

On a side note, if you ever accidentally delete /boot directory simply type the line below - just like this guy. Of course you need the find the appropriate linux-image-x.x.xx-xx-server and you do need to catch this blunder before rebooting.

sudo apt-get install --reinstall linux-image-2.6.32-42-server

Sorting by columns in R

Sorting columns in R is a breeze. If d is a matrix with 2 columns and you want to sort d by column 1, use the command order as below.


Thursday, January 2, 2014

DNA simulation set-up with AMBER

I have been working on the structure and dynamics of single and double stranded DNA for some time now and below is a write up of an easy way to setup the simulations using the AMBER suite of software. Along with primary executables sander, pmemd, tleap and ptraj, AMBER comes with a number of other useful tools. One such tool is the nucleic acid builder (or nab). To create a 10mer poly-Adenosine poly-Thymidine, put the following text in a file called nuc.nab;

molecule m;
m = fd_helix( "abdna", "aaaaaaaaaa", "dna" );
putpdb( "nuc.pdb", m, "-wwpdb");

Then run these in the terminal

nab nuc.nab
./a.out

You should get a nuc.pdb file which contains the poly A-T double stranded DNA. Everything so far is available in more detail at http://ambermd.org/tutorials/basic/tutorial1/section2.htm

To get a single stranded poly-A DNA simply delete the lines corresponding to poly-T. To create stem-loop type configurations commonly found in RNA, do the following. Say you want the ssDNA

AAATAGAGCTAGTGAGGATTT

with the first 4 bp [AAAT] paired with the last 4 [TTTA or ATTT if you want to read from above]. For this I simply generate a double stranded DNA like so...

AAATAGAGCTAGTGAGGATTT
TTTATCTCGATCACTCCTAAA

Then delete the bases shown in red from the PDB file.

AAATAGAGCTAGTGAGGATTT
TTTATCTCGATCACTCCTAAA

Now you should have

AAATAGAGCTAGTGAGG
TTTA

This is the same as AAATAGAGCTAGTGAGGATTT but with the ends paired up. For the stem-loop conformation you should be able to use the parameter and topology files generated for the fully stretched single stranded DNA. You will have a long bond between  AAATAGAGCTAGTGAGG--and--ATTT. But this can be easily fixed with a quick minimization. 

Wednesday, December 4, 2013

Toggle case of alphabets in /vi/ and console

tr 'a-z' 'A-Z' < contacts.txt

Case of letters in the file contacts.txt can be changed from lower to upper using the console command above. In vi the same can be achieved by switching to command mode and typing the tilde key on the letter of choice. For bulk edits visualization mode (Ctrl+v) works well. More information about this can be found at: http://vim.wikia.com/wiki/Switching_case_of_characters

Friday, November 29, 2013

Installing Octave on MacBook

Here are the notes I took while successfully installing Octave on MacBook 10.8.4


Monday, November 11, 2013

Exploring Apple Keynote

I am trying out Apple's Keynote to see what the fuss is all about. dashkards.com/keynote is a great site where I found this:

Wednesday, November 6, 2013

C style formatting in R

Numbering/naming files in a controllable format is important when making animations of a series of plots (by using animate for example). When the plots are being generated in R, there is an easy way to control the names of the output files as shown below;


The advantage here is that when you feed in files with the same base.name and numbered 000..100 (instead of 0..100), the command convert automatically reads them in increasing order w/o you relying on time stamps and such. 

Wednesday, October 30, 2013

Linux terminal colors (Console, ls and vi)

The lines below when put in my .bashrc file greatly improved the readability - I essentially turn the color scheme off.

# Below is from http://mylinuxbook.com/ubuntu-command-line-prompt-colour/
if [ "$color_prompt" = yes ]; then
    PS1='${debian_chroot:+($debian_chroot)}\[\033[0;31m\]\u@\h\[\033[00m\]:\[\033[01;34m\]\w\[\033[00m\]\$ '
else
    PS1='${debian_chroot:+($debian_chroot)}\u@\h:\w\$ '
fi

alias ls='ls --color=none'

Further these lines in .vimrc file were of great help.

syntax on
colorscheme desert

Tuesday, October 22, 2013

ImageMagick's display

On Linux terminal the command /display/ simply displays a figure w/o any resizing. This can get cumbersome when dealing with large images. However, a simple resize option simplifies life:

display -resize 1080x\> figure.png

where the width is being resized to 1080 pixels while the height is automatically assigned. This link suggests using this approach only for downsizing images. 

Saturday, October 19, 2013

Friday, October 18, 2013

Input arguments for /scanf/ type commands

For executables that require user-input, data can be fed in the following manner:

echo 5|pdb2gmx -f box.his.pdb -o box150

where 5 is the input argument that would otherwise have to be given after pdb2gmx takes its time running through its code that comes before a scanf type statement. This approach saves time and automates the process provided you know which argument to feed in. You can extend this any number of arguments like so...here 5 is argument 1 and 50 is argument 2.

echo 5 50|pdb2gmx -f box.his.pdb -o box150

Wednesday, October 9, 2013

Link between common distributions

People dealing with large data sets often find themselves using one of the many standard distribution functions to explain their data. Some of the more commonly used distributions are binomial, Gaussian and Poisson. Interestingly the latter two can be derived from the binomial distribution in that the Poisson distribution is a limit of the binomial distribution and the Gaussian is a limit of the Poisson. The derivations below (conveniently lifted from the web) elaborate.
Source:
http://www.roe.ac.uk/japwww/teaching/astrostats/astrostats2012_part2.pdf
http://www.physik.uzh.ch/~psaha/pda/

Wednesday, October 2, 2013

Installing Citrix on a 64bit Linux box (Ubuntu)

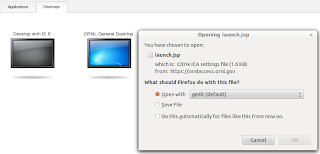
I had previously managed to install Citrix on a 32bit Linux box with little pain but I had a very different experience when dealing with 64bit Linux. Anyway I solved the issues and got it running. Below are the steps involved. You need Citrix if you see a screen similar to the ones below.

- Download 64bit Citrix. Supplied either by your institution or a relevant one at http://www.citrix.com/downloads/citrix-receiver/linux/receiver-for-linux-121.html
- Run dpkg -i ...deb. It will fail. Let it fail.
- Edit /var/lib/dpkg/info/icaclient.postinst so that this line shows up
 if [ "$arch" = "x86_64" -a "$op_system" = "Linux" ]
- Run dpkg --configure icaclient [no more arguments needed]
- sudo ln -s /etc/ssl/certs/Thawte_Premium_Server_CA.pem /location/of/ICAClient/keystore/cacerts/

That's it!

Make sure dependencies are all of same arch (x86).
nsplugin wrapper is an example for that. This depends on libc6.i386 and other libs.
Install libc6. This will iron out other problems. I thank Zach and Mike for their patience while working this out.

Tuesday, October 1, 2013

VMD 'measure hbonds' syntax

The figure below makes it easy to remember the syntax of VMD's measure hbonds command.


Friday, August 30, 2013

Subsetting data with string matching in R

Getting a subset from a larger pool of data is a major strength in R. This subsetting can be based on numbers or strings; the latter being more challenging. String matching (using grep, grepl, sub) and subsetting (using, well, subset in R) are two separate feature and one can combine them to great effect. Details of what grep, grepl etc can do are at
http://stat.ethz.ch/R-manual/R-devel/library/base/html/grep.html . This site
http://atomicules.co.uk/2010/10/09/invert-a-subset-selection-when-using-grepl-in-r.html
was of great help when I wanted (had) to use grepl in subset but I also wanted to use the invert feature available only in grep and not in grepl. Turns out grepl returns a vectors of T and F which can be easily inverted with a simple !grepl(...)

Thursday, August 15, 2013

Area under a curve

R has a neat way to calculate area under a curve (whether a function/equation or a trend line). The example below describes the two ways in which this can be achieved. rollmean requires library(zoo).


Thursday, August 8, 2013

Making and filling grids with R

I had a table with 64 rows and 130 columns and I needed to map a third dimension as a simple X on the 2D plot based on some criteria. I got this done in R using a code similar to the one below.


Tuesday, August 6, 2013

Contact Maps using VMD

Contact maps are a quick way to identify residues of a protein (or monomer) that interact with residue from another protein, ligand or monomer. The script below helps obtain a distance list:

set seg1 [atomselect top "segname SG03 and name CA"]
set seg2 [atomselect top "segname SG04 and name CA"]

set file [open "Contact_map.dat" w]

set list1 [$seg1 get index]
set list2 [$seg2 get index]

foreach atom1 $list1 {
        foreach atom2 $list2 {
                set index1 [atomselect top "index $atom1"]
                set index2 [atomselect top "index $atom2"]
                set resid1 [[atomselect top "index $atom1"] get resid]
                set resid2 [[atomselect top "index $atom2"] get resid]
                set resnm1 [[atomselect top "index $atom1"] get resname]
                set resnm2 [[atomselect top "index $atom2"] get resname]
     puts $file "$resnm1 $resid1 $resnm2 $resid2 [veclength [vecsub [measure center $index1] [measure center $index2]]]"
                $index1 delete
                $index2 delete
        }
puts $file " "   # I include this line to make it easier to make contour plots using gnuplot.
}

close $file

Aligning hexameric proteins along an axis

This tcl script aligns a hexamer such that its central axis is aligned along the y-axis.


set all [atomselect top protein]
$all moveby [vecscale [measure center $all] -1]

set res10 [atomselect top "resid 10"]
set res40 [atomselect top "resid 40"]

set cenres10 [measure center $res10]
set cenres40 [measure center $res40]

set vector [vecsub $cenres10 $cenres40]

$all move [transvecinv $vector]
$all move [transaxis z 90]

foreach i {A B C D E F} {
        set chain [atomselect top "chain $i and protein and resid 4 to 105"]
        $chain writepdb chain$i.pdb
}


This script is also applicable to trimers, tetramers and other aggregates that have a well defined central axis.

Tuesday, April 23, 2013

Curve fitting in R


This is a simple example of a linear fit where a perfect fit is distorted with the help of a gaussian function. This data is then fit to a linear model. The most important factor determining the success of a fit is the model equation and the second most important factor is suitable starting values of the fit variables (a and b in this case). Further, if you assign the output to a variable called fit, values a and b can be extracted using:

fit < - nls
coef(fit)[1]
coef(fit)[2]

Friday, April 19, 2013

Saving data frames in R

If 'df' is your data frame,
save(df,file="yourfile.rdf",ascii=TRUE)
save the data frame in to a .rdf file which is readable. Although the file as lot more data than you might want, loading the file back into R irons out any wrinkles.
load("yourfile.rdf")
http://stackoverflow.com/questions/8345759/how-to-save-a-data-frame-in-r

Edit Jan 2014
If however you really want to avoid additional lines in the saved file, try the following:
write.table(df,filename,row.names=FALSE,col.names=FALSE)
This should produce a clean file with your data in a neat column.

Wednesday, April 3, 2013

Speaker and Mic settings on Ubuntu Linux

Although Skype and Google video get installed fairly easily on Ubuntu, bad sound settings could be a show stopper. Alsamixer controls the sound and mic and can be force rebooted using:

alsa force-reload
or
alsa reload

This usually fixes most problems. Other useful links:
http://askubuntu.com/questions/164518/hard-resetting-alsa-configuration
http://chriscarey.com/wordpress/2008/07/01/reset-alsa-sound-on-linux/
http://ubuntuforums.org/showthread.php?t=1068612
http://forums.bodhilinux.com/index.php?/topic/3800-solved-how-does-a-user-restart-alsa-without-rebooting/

Friday, March 15, 2013

Mapping 3d data on a 2d color map

Gnuplot has a very easy and straightforward way to convert a x-y-z data into a 3d plot or a 2d color map. Let's write the data in the form;
1 1     0.0
1 2     0.4451
1 3     0.4249

2 1     0.13142
2 2     0.0
2 3     0.983

3 1     xxx
3 2     xxx
3 3

A space between chunks of data is important. Using commands below you can get a 2d plot;

set size square
set pm3d map    # Remove the word 'map' to get a 3d plot
set xrange [1:261]  # Change the range to suit your needs
set yrange [1:261] 
splot 'all.dat'

Wednesday, February 13, 2013

Reducing the file size of PDF documents

gs -sDEVICE=pdfwrite -dCompatibilityLevel=1.4 -dPDFSETTINGS=/screen -dNOPAUSE -dQUIET -dBATCH -sOutputFile=output.pdf input.pdf

I recently made a nice pdf figure using R but the file was 18Mb heavy. With 7 such figures my manuscript was easily crossing the 100Mb mark which felt rather unnecessary. The command above scales down the18Mb file to a tenth of its size. Since these figures are based on vectors, scaling down the file size has little to no impact on the quality of the figure when zoomed in. gs is turning out to be far more potent than I initially thought.

Thursday, January 31, 2013

Sweave, R and Latex

If you use R for your statistical analysis and graph plotting needs and then use those figures in your Latex documents, you will find this interesting. Sweave is a package in R which lets takes in an .rnw file (which contains usual text from a tex document with R commands embedded in it), compiles it (in R) and gives out a tex file. This tex file can in turn be compiled by pdflatex (if you have figures) or plain latex to get a properly formatted pdf/ps/dvi file with relevant R output. There are many excellent examples on the interwebs and I strongly recommend using Sweave right away.  The beauty of this approach is that on can save a lot of time by not spending on choosing the appropriate dimensions of a a png or an eps output. Sweave does it for you.

Edit: If you want to insert a R-generated figure then add this to your tex file:

\begin{figure}
\begin{center}
<
\end{center}
\end{figure}


If you want to insert text from R but properly tabbed and with all the ampersands added, then add these lines to your tex file:

<

Tuesday, January 29, 2013

Manipulating dihedral angles in VMD

VMD's scripting interface is quite powerful. It has a trans bond command which gives the transformation matrix required to achieve desired dihedral rotation. If you want to edit the dihedral 1-2-3-4 (i.e. rotate around bond 2-3), then you first select the set of atoms on which the transformation is to be applied; 1,2,5,6,7,8,9 in this case. To this selection you apply the transformation;

$moveselection move [trans bond [lindex [$a1 get {x y z}] 0] [lindex [$a2 get {x y z}] 0] 10 deg]

trans bond expects only the atom indices. The value 10 indicates the magnitude and sign of change to the dihedral 1-2-3-4. deg says the change should be in degrees and not radians. To get a nice picture of rotation around a bond use this script:

set movesel [atomselect top "index 1 2 5 6 7 8 9"]
for {set i 0} {$i <360 } {incr i 10}

{
$movesel move [trans bond [lindex [$a1 get {x y z}] 0] [lindex [$a2 get {x y z}] 0] 10 deg]
render TachyonInternal [format "rotate%03d.tga" $i]
}

Friday, January 25, 2013

Joining multiple pdf files in Linux

gs -dBATCH -dNOPAUSE -q -sDEVICE=pdfwrite -sOutputFile=finished.pdf file[1-3].pdf

This is a great way to join many pdf files into one file. Mac's Preview has another way to do the same but in a much easier drag-and-drop fashion. The line below in my .bashrc file helps automate the concatenation process.

alias join='gs -dBATCH -dNOPAUSE -q -sDEVICE=pdfwrite -sOutputFile=awkwardName.pdf'

Thursday, January 24, 2013

time and script

These are great commands in Linux while debugging and timing codes.

Monday, January 21, 2013

Combining figures into one PDF file


convert -compress JPEG *.jpg output.pdf
convert -compress Zip *.jpg output.pdf

Both the commands join a bunch of jpeg files into one pdf file. This came in handy recently. Dropping the compress flag and its options gave a smaller file. Might look into it later.

convert *.jpg output.pdf

Sunday, January 6, 2013

Bibtex being bibtex

Do you notice any difference between this:


@article{Dashnau2007Computational,
    abstract = {.....}
    author = {Dashnau, J. L. and Vanderkooi, J. M.},
    journal = {J. Food Sci.},
    month = jan,
    number = {1},
    pages = {R001--R010},
    title = {{Computational Approaches to Investigate How Biological Macromolecules Can Be Protected in Extreme Conditions}},
    volume = {72},
    year = {2007}
}

and this:


@article{Dashnau2007Computational,
    abstract = {.....}
    author = {Dashnau, J. L. and Vanderkooi, J. M.},
    journal = {J. Food Sci.}
    month = jan,
    number = {1},
    pages = {R001--R010},
    title = {{Computational Approaches to Investigate How Biological Macromolecules Can Be Protected in Extreme Conditions}},
    volume = {72},
    year = {2007}
}

Well, I couldn't either. Notice the comma at the end of the journal entry? Well without the comma Bibtex ignores the ensuing metadata creating problems when compiling your document. Something to be careful about.

Thursday, December 27, 2012

Batch cropping images using Mogrify


The command 'mogrify' can crop multiple images simultaneously. Sample case is below.
mogrify -crop WidthxHeight+x+y        images*.png
mogrify -crop 2796x983+429+327        images*.png
The values of width, height, x and y can be obtained by opening an image in Gimp and selecting the rectangle of interest.

Monday, December 24, 2012

Firefox/Thunderbird already running but not responding

Firefox and Thunderbird can sometimes give this error when you restart a linux box or when you try to make multiple log ins into a shared file system. The result is that Firefox/Thunderbird will not open. The causes for this are not entirely clear to me but I found a solution. Simply delete the .parentlock file in both cases and restart the service. Locations for this file are as follows:
Firefox: ~/.mozilla/firefox/xxxxx.default/.parentlock
Thunderbird: ~/.thunderbird/xxxxx.default/.parentlock
Since both the folders and files start with a dot, they are not visible with a simple
ls -lrt
You have to use
ls -lrta

Saturday, December 15, 2012

Emacs Primer

I decided just a little while ago that it was time I learned how to use a text editor other than vi. Below are my notes as I keep learning more about Emacs.

Open a new file: emacs newfile.txt &

Starting writing in the file.

Save: ctrl x s
Search Forward: ctrl s
Search Reverse: ctrl r

Exit emacs: ctrl x c

Select Region:      ctrl space and arrows
Mark Activate:      ctrl space
Mark Deactivate: ctrl space or ctrl g
Select All: ctrl x (wait) h

Delete Region: ctrl w
Copy Region:   Esc  w
Paste buffer: ctrl y

Delete till end of sentence: ctrl k

Delete line: ctrl S backspace

Delete next word: Esc d

Undo last action: ctrl _ (underscore)

Jump to end of file: Esc >
Jump to start of file: Esc <
Go to line 10: Esc x 10   

List all buffers: ctrl x (leave ctrl) b

Split screen:                                   ctrl x (leave ctrl) 2
Close all but current buffer:     ctrl x (leave ctrl) 1
Close only the current buffer:  ctrl x (leave ctrl) 0

Repeat 9 times: ctrl u (leave ctrl) 9
Type - 9 times: ctrl u (leave ctrl) 9 -

If you start a command and then decide you don't want to complete it, type C-g to cancel it.

http://doors.stanford.edu/~sr/computing/emacs.html
http://www.nbcs.rutgers.edu/newdocs/unx01101/unx01101.php3
http://dept.cs.williams.edu/~kim/cs136/s04/emacs.html

Edit: Dec 28, 2012
I was writing a manuscript in Emacs and the bibtex reference key had a beta symbol which meant that I had to type this into Emacs;   Kheterpal2000Aβ and not Kheterpal2000$\beta$. To do this I copied the following two lines into ~/.emacs and solved my problem. Thanks to this site.
(global-set-key (kbd " a") "α") ; F9 followed by a
(global-set-key (kbd " b") "β")
 

Tuesday, November 6, 2012

Latex Template

Reminding myself of every detail in the assigning of packages and page type in Latex seems like a bit of a chore. So I copied the following from a working .tex file to reduce redundancy.

\documentclass[12pt,doublespace]{article}
\usepackage[top=3cm,bottom=3cm,left=2.5cm,right=2.5cm]{geometry}
\usepackage{rotating}
\usepackage{apacite}

\begin{document}
\title{}
\author{
Name
\small Affiliation
\and
New Name
\small Affiliation
}

\maketitle
\begin{abstract}
...
\end{abstract}

\section{}
Main body

\end{document}

Wednesday, October 17, 2012

pdflatex vs pdftex

I have a document with lot of .eps figures embedded in it. These figures were of high quality but also large size. To cut down on the size I converted them to .png which were a tenth of the .eps format. Now using
latex file.tex (with eps figures)
worked well. But to use .png figures I thought I had to use pdftex.
pdftex file.tex (with png figures)
Turns out I should have used pdflatex instead. I ended up losing quite some time on this. The switch to pdflatex did the job and gave me a file which was a tenth of the original size. More on this from here:

"pdftex expects the file to be plain TeX. pdflatex expects it to be LaTeX. These
are two different dialects of TeX. You do not expect a C compiler to work with
Java, do you?

Note that in practice pdftex and pdflatex are often the same command, which
analyzes how it was called to switch to the proper input language. On some
systems gcc behaves in the same way, compiling C if it is called as gcc or
Fortran if it is called as gfortran."

Bottom line, figures can be heavily compressed by converting them to png format w/o a large loss in clarity; and pdflatex can handle png figures. Even if there is a loss of clarity, this is usually just fine for supporting information; maybe not so much for main article.

Tuesday, October 16, 2012

Monday, October 15, 2012

Handling references using BibTex


Scientific journals with arbitrary requirements for reference styles can be a source of great heart-ache. When writing articles using Latex-BibTex, ability to handle reference styles can be useful. These articles are a great starting point to learn more about this:
http://amath.colorado.edu/documentation/LaTeX/reference/faq/bibstyles.html#styles
http://chenfuture.wordpress.com/2007/09/24/diy-your-bibtex-style-file/
http://www.math.washington.edu/tex-archive/macros/latex/contrib/custom-bib/merlin.pdf

Tuesday, October 9, 2012

Controlling axis properties in R

http://www.programmingr.com/content/controlling-margins-and-axes-oma-and-mgp/

The mgp option
In addition to changing the margin size of your charts, you may also want to change the way axes and labels are spatially arranged. One method of doing so is the mgp parameter option. The mgp setting is defined by a three item vector wherein the first value represents the distance of the axis labels or titles from the axes, the second value is the distance of the tick mark labels from the axes, and the third is the distance of the tick mark symbols from the axes. As with the oma option discussed above, the distances are given in line widths. The defaults for the mgp setting are c(3, 1, 0). The examples below illustrate the effects of changing the various mgp values. Note: the mgp.axis() function in the Hmisc package can be used to change these settings for each axis individually.

Tuesday, October 2, 2012

ImageJ Resources

http://rsbweb.nih.gov/ij/
http://www.fmhs.auckland.ac.nz/sms/biru/facilities/analysis_resources.aspx

Learning ImageJ

ImageJ is a fantastic light-weight tool to analyze and manipulate images. I needed to use it for quickly analyzing microscopy images. Here I will list features of ImageJ that I found particularly useful for my purposes:
- I took a bunch of images at various gains to find out the point where bleaching starts occurring. So I have a series of images in which the pixel intensity varies from 0 to 255.

ImageJ allows me to load the images as a stack and calculate the maximum pixel value in each image by selecting the whole image and hitting 'm' (for measure). Plotting the maximum value gives this:


So, bleaching occurs somewhere between a gain of 450 and 475.

Friday, September 14, 2012

Print page-range using lpr

I use the extremely light-weight pdf viewer, xpdf. For some unknown reason, I cannot print pages from xpdf. A nice workaround I found was with dear old lpr which can print a range of pages thus;
lpr -P HP_LaserJet_6MP file.pdf -o page-ranges=2-5
lpstat -a # Gives the status (and names) of all the connected printers

Wednesday, September 5, 2012

Batch processing images in Gimp

Over the past few weeks I've had to apply a specific set of changes to a large number of images. Doing this repeatedly took a great toll on my soul and Gimp came to my soul's rescue. Take a read at this and this and help yourself.

Thursday, August 23, 2012

Memory convservation in R

Depending on how large a data set you are handling, R can take up large swaths of your RAM and slow down other processes. It is therefore a good idea to remove unused variables.
ls()  # Gives the list of variables/arrays currently in use.
rm(list=ls()) # Removes all the variables and frees up memory.
Useful links:
 http://www.matthewckeller.com/html/memory.html

Wednesday, August 22, 2012

Benchmarking Simulations

It is always a good idea to benchmark your simulations and select the optimal number of cores for your simulations. This exercise greatly reduces wastage of resources and time. The script below helps with the setup. You need files conf.in and template.pbs

for i in 24 48 96 192 240 576 960 1200; do
        mkdir scaling$i
        cp conf.in scaling$i
        sed 's/xxx/'$i'/g' template.pbs > scaling${i}/sub.pbs
        echo "cd scaling$i";
        echo "aprun -n $i $namd conf.in 2>&1 1> conf.out &";  
        echo "cd \$PBS_O_WORKDIR";
done

exit;


----- Template.pbs ------
#PBS -q debug
#PBS -l mppwidth=xxx
#PBS -l walltime=00:30:00
#PBS -N scaling
#PBS -S /bin/bash
#PBS -j oe

namd=/usr/common/usg/namd/2.8/bin/namd2
cd $PBS_O_WORKDIR
aprun -n xxx $namd conf.in 2>&1 1> conf.out

Tuesday, August 21, 2012

Making 2D heat-maps of protein secondary structure

I needed to make 2D heat-maps of protein structure with time on x-axis and protein residues on y-axis. This helps to see the time evolution of structure quite nicely. This is easily accomplished by loading the trajectory in VMD and sourcing the file ss_traj.tcl and going through your entire trajectory once. This creates a buffer with all the structure information. ss_traj.tcl creates a ss_traj.dat file which has the structure information. This ss_traj.dat file is then used by ss_plot.c, after compilation of course, to generate a .ps file with the desired output. All this is explained quite well here. I made a personal copy of the files here:
ss_traj.tcl
ss_plot.c
Sample ss_traj.dat file.

Once you have the output in .ps format you can do interesting things to change the file. The 7th line has the scaling information. The width and height of the output were not to my satisfaction; so I changed the scaling factors to adjust the display. Also the executable could crash when running due to memory requirements. Simply change the dimensions of the array in ss_plot.c according to your needs.

Thursday, August 2, 2012

Reading/processing multiple files in R

j<-1;
for (i in seq(300,390,15)) {
df<-read.table(paste("sasa",i,".txt",sep=``));
# Files are named "sasa300.txt" for ex.
tab[j,]<-cbind(i,mean(df[,2]),sd(df[,2]));
print(tab[j,]);
j<-j+1;
}
> tab
     [,1]     [,2]      [,3]
[1,]  300 3408.514  96.48097
[2,]  315 3422.388 119.14861
[3,]  330 3391.590  81.57252
[4,]  345 3424.176  84.84211
[5,]  360 3394.205 100.37193
[6,]  375 3462.469 122.60486
[7,]  390 3438.328  92.70519


Wednesday, July 25, 2012

Quick and dirty way to plot error bars in R

If you have data that looks as follows, a one line command can draw error bars to the plot.
-x---T-----y-------------error-----
p5 315 2.513402 0.5711628                                                      
p5 330 2.173868 0.4711594                                                      
p5 345 2.132954 0.634045                                                       
p5 360 2.092686 0.4851832                                                      
p5 375 2.966971 0.9165328                                                      
p5 390 2.214886 0.4288291

r<-read.table("data.txt")
plot(r[,2],r[,3],ylim=c(0,4))
lines(r[,2],r[,3])
for(i in 1:length(r[,1])) {segments(r[i,2],r[i,3]+r[i,4],r[i,2],r[i,3]-r[i,4])}

I am drawing a simple line from (x,y+err) to (x,y-err). The result is not as fancy as other efforts but it is enough for my purposes.