Monday, December 9, 2013

Wednesday, December 4, 2013
Toggle case of alphabets in /vi/ and console
tr 'a-z' 'A-Z' < contacts.txt
Case of letters in the file contacts.txt can be changed from lower to upper using the console command above. In vi the same can be achieved by switching to command mode and typing the tilde key on the letter of choice. For bulk edits visualization mode (Ctrl+v) works well. More information about this can be found at: http://vim.wikia.com/wiki/Switching_case_of_characters
Case of letters in the file contacts.txt can be changed from lower to upper using the console command above. In vi the same can be achieved by switching to command mode and typing the tilde key on the letter of choice. For bulk edits visualization mode (Ctrl+v) works well. More information about this can be found at: http://vim.wikia.com/wiki/Switching_case_of_characters
Friday, November 29, 2013
Installing Octave on MacBook
Here are the notes I took while successfully installing Octave on MacBook 10.8.4


Monday, November 11, 2013
Exploring Apple Keynote
I am trying out Apple's Keynote to see what the fuss is all about. dashkards.com/keynote is a great site where I found this:

Wednesday, November 6, 2013
C style formatting in R
Numbering/naming files in a controllable format is important when making animations of a series of plots (by using animate for example). When the plots are being generated in R, there is an easy way to control the names of the output files as shown below;

The advantage here is that when you feed in files with the same base.name and numbered 000..100 (instead of 0..100), the command convert automatically reads them in increasing order w/o you relying on time stamps and such.
The advantage here is that when you feed in files with the same base.name and numbered 000..100 (instead of 0..100), the command convert automatically reads them in increasing order w/o you relying on time stamps and such.
Wednesday, October 30, 2013
Linux terminal colors (Console, ls and vi)
The lines below when put in my .bashrc file greatly improved the readability - I essentially turn the color scheme off.
# Below is from http://mylinuxbook.com/ubuntu-command-line-prompt-colour/
if [ "$color_prompt" = yes ]; then
PS1='${debian_chroot:+($debian_chroot)}\[\033[0;31m\]\u@\h\[\033[00m\]:\[\033[01;34m\]\w\[\033[00m\]\$ '
else
PS1='${debian_chroot:+($debian_chroot)}\u@\h:\w\$ '
fi
alias ls='ls --color=none'
Further these lines in .vimrc file were of great help.
syntax on
colorscheme desert
Tuesday, October 22, 2013
ImageMagick's display
On Linux terminal the command /display/ simply displays a figure w/o any resizing. This can get cumbersome when dealing with large images. However, a simple resize option simplifies life:
display -resize 1080x\> figure.png
where the width is being resized to 1080 pixels while the height is automatically assigned. This link suggests using this approach only for downsizing images.
display -resize 1080x\> figure.png
where the width is being resized to 1080 pixels while the height is automatically assigned. This link suggests using this approach only for downsizing images.
Saturday, October 19, 2013

Friday, October 18, 2013
Input arguments for /scanf/ type commands
For executables that require user-input, data can be fed in the following manner:
echo 5|pdb2gmx -f box.his.pdb -o box150
where 5 is the input argument that would otherwise have to be given after pdb2gmx takes its time running through its code that comes before a scanf type statement. This approach saves time and automates the process provided you know which argument to feed in. You can extend this any number of arguments like so...here 5 is argument 1 and 50 is argument 2.
echo 5 50|pdb2gmx -f box.his.pdb -o box150
echo 5 50|pdb2gmx -f box.his.pdb -o box150
Wednesday, October 9, 2013
Link between common distributions
People dealing with large data sets often find themselves using one of the many standard distribution functions to explain their data. Some of the more commonly used distributions are binomial, Gaussian and Poisson. Interestingly the latter two can be derived from the binomial distribution in that the Poisson distribution is a limit of the binomial distribution and the Gaussian is a limit of the Poisson. The derivations below (conveniently lifted from the web) elaborate.


Source:
http://www.roe.ac.uk/japwww/teaching/astrostats/astrostats2012_part2.pdf
http://www.physik.uzh.ch/~psaha/pda/


Wednesday, October 2, 2013
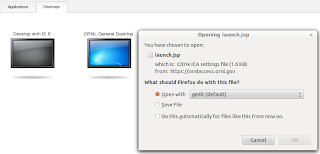
Installing Citrix on a 64bit Linux box (Ubuntu)
I had previously managed to install Citrix on a 32bit Linux box with little pain but I had a very different experience when dealing with 64bit Linux. Anyway I solved the issues and got it running. Below are the steps involved. You need Citrix if you see a screen similar to the ones below.

- Download 64bit Citrix. Supplied either by your institution or a relevant one at http://www.citrix.com/downloads/citrix-receiver/linux/receiver-for-linux-121.html
- Run dpkg -i ...deb. It will fail. Let it fail.
- Edit /var/lib/dpkg/info/icaclient.postinst so that this line shows up
if [ "$arch" = "x86_64" -a "$op_system" = "Linux" ]
- Run dpkg --configure icaclient [no more arguments needed]
- sudo ln -s /etc/ssl/certs/Thawte_Premium_Server_CA.pem /location/of/ICAClient/keystore/cacerts/
That's it!
Make sure dependencies are all of same arch (x86).
nsplugin wrapper is an example for that. This depends on libc6.i386 and other libs.
Install libc6. This will iron out other problems. I thank Zach and Mike for their patience while working this out.
Tuesday, October 1, 2013
VMD 'measure hbonds' syntax
The figure below makes it easy to remember the syntax of VMD's measure hbonds command.


Friday, August 30, 2013
Subsetting data with string matching in R
Getting a subset from a larger pool of data is a major strength in R. This subsetting can be based on numbers or strings; the latter being more challenging. String matching (using grep, grepl, sub) and subsetting (using, well, subset in R) are two separate feature and one can combine them to great effect. Details of what grep, grepl etc can do are at
http://stat.ethz.ch/R-manual/R-devel/library/base/html/grep.html . This site
http://atomicules.co.uk/2010/10/09/invert-a-subset-selection-when-using-grepl-in-r.html
was of great help when I wanted (had) to use grepl in subset but I also wanted to use the invert feature available only in grep and not in grepl. Turns out grepl returns a vectors of T and F which can be easily inverted with a simple !grepl(...)
Thursday, August 15, 2013
Area under a curve
R has a neat way to calculate area under a curve (whether a function/equation or a trend line). The example below describes the two ways in which this can be achieved. rollmean requires library(zoo).

Thursday, August 8, 2013
Making and filling grids with R
I had a table with 64 rows and 130 columns and I needed to map a third dimension as a simple X on the 2D plot based on some criteria. I got this done in R using a code similar to the one below.


Tuesday, August 6, 2013
Contact Maps using VMD
Contact maps are a quick way to identify residues of a protein (or monomer) that interact with residue from another protein, ligand or monomer. The script below helps obtain a distance list:
set seg1 [atomselect top "segname SG03 and name CA"]
set seg2 [atomselect top "segname SG04 and name CA"]
set file [open "Contact_map.dat" w]
set list1 [$seg1 get index]
set list2 [$seg2 get index]
foreach atom1 $list1 {
foreach atom2 $list2 {
set index1 [atomselect top "index $atom1"]
set index2 [atomselect top "index $atom2"]
set resid1 [[atomselect top "index $atom1"] get resid]
set resid2 [[atomselect top "index $atom2"] get resid]
set resnm1 [[atomselect top "index $atom1"] get resname]
set resnm2 [[atomselect top "index $atom2"] get resname]
puts $file "$resnm1 $resid1 $resnm2 $resid2 [veclength [vecsub [measure center $index1] [measure center $index2]]]"
$index1 delete
$index2 delete
}
puts $file " " # I include this line to make it easier to make contour plots using gnuplot.
}
close $file
Aligning hexameric proteins along an axis
This tcl script aligns a hexamer such that its central axis is aligned along the y-axis.
set all [atomselect top protein]
$all moveby [vecscale [measure center $all] -1]
set res10 [atomselect top "resid 10"]
set res40 [atomselect top "resid 40"]
set cenres10 [measure center $res10]
set cenres40 [measure center $res40]
set vector [vecsub $cenres10 $cenres40]
$all move [transvecinv $vector]
$all move [transaxis z 90]
foreach i {A B C D E F} {
set chain [atomselect top "chain $i and protein and resid 4 to 105"]
$chain writepdb chain$i.pdb
}
This script is also applicable to trimers, tetramers and other aggregates that have a well defined central axis.
Tuesday, April 23, 2013
Curve fitting in R

This is a simple example of a linear fit where a perfect fit is distorted with the help of a gaussian function. This data is then fit to a linear model. The most important factor determining the success of a fit is the model equation and the second most important factor is suitable starting values of the fit variables (a and b in this case). Further, if you assign the output to a variable called fit, values a and b can be extracted using:
fit < - nls
coef(fit)[1]
coef(fit)[2]
Friday, April 19, 2013
Saving data frames in R
If 'df' is your data frame,
save(df,file="yourfile.rdf",ascii=TRUE)
save the data frame in to a .rdf file which is readable. Although the file as lot more data than you might want, loading the file back into R irons out any wrinkles.
load("yourfile.rdf")
http://stackoverflow.com/questions/8345759/how-to-save-a-data-frame-in-r
Edit Jan 2014
If however you really want to avoid additional lines in the saved file, try the following:
write.table(df,filename,row.names=FALSE,col.names=FALSE)
This should produce a clean file with your data in a neat column.
Wednesday, April 3, 2013
Speaker and Mic settings on Ubuntu Linux
Although Skype and Google video get installed fairly easily on Ubuntu, bad sound settings could be a show stopper. Alsamixer controls the sound and mic and can be force rebooted using:
alsa force-reload
or
alsa reload
This usually fixes most problems. Other useful links:
http://askubuntu.com/questions/164518/hard-resetting-alsa-configuration
http://chriscarey.com/wordpress/2008/07/01/reset-alsa-sound-on-linux/
http://ubuntuforums.org/showthread.php?t=1068612
http://forums.bodhilinux.com/index.php?/topic/3800-solved-how-does-a-user-restart-alsa-without-rebooting/
Friday, March 15, 2013
Mapping 3d data on a 2d color map
Gnuplot has a very easy and straightforward way to convert a x-y-z data into a 3d plot or a 2d color map. Let's write the data in the form;
1 1 0.0
1 2 0.4451
1 3 0.4249
2 1 0.13142
2 2 0.0
2 3 0.983
3 1 xxx
3 2 xxx
3 3
A space between chunks of data is important. Using commands below you can get a 2d plot;
set size square
set pm3d map # Remove the word 'map' to get a 3d plot
set xrange [1:261] # Change the range to suit your needs
set yrange [1:261]
splot 'all.dat'
Wednesday, February 13, 2013
Reducing the file size of PDF documents
gs -sDEVICE=pdfwrite -dCompatibilityLevel=1.4 -dPDFSETTINGS=/screen -dNOPAUSE -dQUIET -dBATCH -sOutputFile=output.pdf input.pdf
I recently made a nice pdf figure using R but the file was 18Mb heavy. With 7 such figures my manuscript was easily crossing the 100Mb mark which felt rather unnecessary. The command above scales down the18Mb file to a tenth of its size. Since these figures are based on vectors, scaling down the file size has little to no impact on the quality of the figure when zoomed in. gs is turning out to be far more potent than I initially thought.
I recently made a nice pdf figure using R but the file was 18Mb heavy. With 7 such figures my manuscript was easily crossing the 100Mb mark which felt rather unnecessary. The command above scales down the18Mb file to a tenth of its size. Since these figures are based on vectors, scaling down the file size has little to no impact on the quality of the figure when zoomed in. gs is turning out to be far more potent than I initially thought.
Thursday, January 31, 2013
Sweave, R and Latex
If you use R for your statistical analysis and graph plotting needs and then use those figures in your Latex documents, you will find this interesting. Sweave is a package in R which lets takes in an .rnw file (which contains usual text from a tex document with R commands embedded in it), compiles it (in R) and gives out a tex file. This tex file can in turn be compiled by pdflatex (if you have figures) or plain latex to get a properly formatted pdf/ps/dvi file with relevant R output. There are many excellent examples on the interwebs and I strongly recommend using Sweave right away. The beauty of this approach is that on can save a lot of time by not spending on choosing the appropriate dimensions of a a png or an eps output. Sweave does it for you.
Edit: If you want to insert a R-generated figure then add this to your tex file:
\begin{figure}
\begin{center}
<
\end{center}
\end{figure}
If you want to insert text from R but properly tabbed and with all the ampersands added, then add these lines to your tex file:
<
Edit: If you want to insert a R-generated figure then add this to your tex file:
\begin{figure}
\begin{center}
<
\end{center}
\end{figure}
If you want to insert text from R but properly tabbed and with all the ampersands added, then add these lines to your tex file:
<
Tuesday, January 29, 2013
Manipulating dihedral angles in VMD

$moveselection move [trans bond [lindex [$a1 get {x y z}] 0] [lindex [$a2 get {x y z}] 0] 10 deg]
trans bond expects only the atom indices. The value 10 indicates the magnitude and sign of change to the dihedral 1-2-3-4. deg says the change should be in degrees and not radians. To get a nice picture of rotation around a bond use this script:
for {set i 0} {$i <360 } {incr i 10}
{
$movesel move [trans bond [lindex [$a1 get {x y z}] 0] [lindex [$a2 get {x y z}] 0] 10 deg]
render TachyonInternal [format "rotate%03d.tga" $i]
}
Friday, January 25, 2013
Joining multiple pdf files in Linux
gs -dBATCH -dNOPAUSE -q -sDEVICE=pdfwrite -sOutputFile=finished.pdf file[1-3].pdf
This is a great way to join many pdf files into one file. Mac's Preview has another way to do the same but in a much easier drag-and-drop fashion. The line below in my .bashrc file helps automate the concatenation process.
alias join='gs -dBATCH -dNOPAUSE -q -sDEVICE=pdfwrite -sOutputFile=awkwardName.pdf'
Thursday, January 24, 2013
Monday, January 21, 2013
Combining figures into one PDF file
convert -compress JPEG *.jpg output.pdf
convert -compress Zip *.jpg output.pdf
Both the commands join a bunch of jpeg files into one pdf file. This came in handy recently. Dropping the compress flag and its options gave a smaller file. Might look into it later.
convert *.jpg output.pdf
Sunday, January 6, 2013
Bibtex being bibtex
Do you notice any difference between this:
@article{Dashnau2007Computational,
abstract = {.....}
author = {Dashnau, J. L. and Vanderkooi, J. M.},
journal = {J. Food Sci.},
month = jan,
number = {1},
pages = {R001--R010},
title = {{Computational Approaches to Investigate How Biological Macromolecules Can Be Protected in Extreme Conditions}},
volume = {72},
year = {2007}
}
and this:
@article{Dashnau2007Computational,
abstract = {.....}
author = {Dashnau, J. L. and Vanderkooi, J. M.},
journal = {J. Food Sci.}
month = jan,
number = {1},
pages = {R001--R010},
title = {{Computational Approaches to Investigate How Biological Macromolecules Can Be Protected in Extreme Conditions}},
volume = {72},
year = {2007}
}
Well, I couldn't either. Notice the comma at the end of the journal entry? Well without the comma Bibtex ignores the ensuing metadata creating problems when compiling your document. Something to be careful about.
@article{Dashnau2007Computational,
abstract = {.....}
author = {Dashnau, J. L. and Vanderkooi, J. M.},
journal = {J. Food Sci.},
month = jan,
number = {1},
pages = {R001--R010},
title = {{Computational Approaches to Investigate How Biological Macromolecules Can Be Protected in Extreme Conditions}},
volume = {72},
year = {2007}
}
and this:
@article{Dashnau2007Computational,
abstract = {.....}
author = {Dashnau, J. L. and Vanderkooi, J. M.},
journal = {J. Food Sci.}
month = jan,
number = {1},
pages = {R001--R010},
title = {{Computational Approaches to Investigate How Biological Macromolecules Can Be Protected in Extreme Conditions}},
volume = {72},
year = {2007}
}
Well, I couldn't either. Notice the comma at the end of the journal entry? Well without the comma Bibtex ignores the ensuing metadata creating problems when compiling your document. Something to be careful about.
Subscribe to:
Posts (Atom)